Mi 20.12., 14-16 Uhr, Grimm-Zentrum, Auditorium
Vortrag und Gespräch auf englisch.
This talk is about the science of visualizing networks. Although the field of graph drawing, as we call it, has no shortage of theoretical contributions, those have always followed practices; and with a sensible delay. Mathieu Jacomy, co-founder of the network visualization tool Gephi, will sketch the double story of the craftsmanship and the academic evaluation of representing networks as dots and lines, from Jacob Moreno’s sociograms, to Peter Eades‘ first force-driven layout algorithms, to Helen Purchase’s aesthetic criteria, and finally to the data deluge and the availability of large complex networks, paving the way to network science. This story will show how practices shape cultures in ways that escape the control of academics, at once bad and good, uninformed yet innovative, unjustified yet meaningful. Reading a large complex network is not the same as a small diagram, and the talk will provide illustrations of the ideas that had to be left behind to properly frame graph drawing as a mediation driven by technology. Which will also help you read large network maps properly.
Mathieu Jacomy is Doctor of Techno-Anthropology and assistant professor at the Aalborg University Tantlab, and MASSHINE center. He was a research engineer for 10 years at the Sciences Po médialab in Paris, and is a co-founder of Gephi, a popular network visualization tool. He develops digital instruments involving data visualization and network analysis for the social science and humanities. His current research focuses on visual network analysis, digital controversy mapping, and computational social science. He toots at @jacomyma@mas.to and blogs at reticular.hypotheses.org.
Der Vortrag ist Teil der Reihe „Werkzeug. Zur Praxis computergestützter Forschung in den Geistes- und Kulturwissenschaften“. Weitere Termine der Reihe: https://hu.berlin/werkzeug.
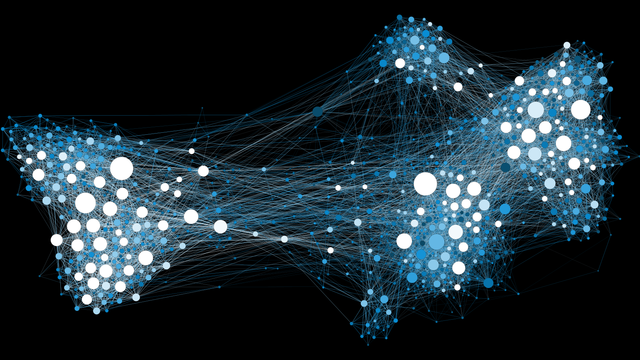
Bild oben: Netzwerk mit 1000 Knoten und sichtbaren Clustern, mit Gephi erstellt. Martin Grandjean, CC BY-SA 4.0 https://creativecommons.org/licenses/by-sa/4.0, via Wikimedia Commons, https://commons.wikimedia.org/wiki/File:Social_Network_Visualization.png.


